How to plot multiple functions on the same figure, in Matplotlib?
How can I plot the following 3 functions (i.e. sin, cos and the addition), on the domain t, in the same figure?
How can I plot the following 3 functions (i.e. sin, cos and the addition), on the domain t, in the same figure?
I’m writing a python application that will make heavy use of a graph data structure. Nothing horribly complex, but I’m thinking some sort of graph/graph-algorithms library would help me out. I’ve googled around, but I don’t find anything that particularly leaps out at me. Anyone have any good recommendations? Answers: Thank you for visiting the … Read more
How do you trace the path of a Breadth-First Search, such that in the following example:
Is there an explicit equivalent command in Python’s matplotlib for Matlab’s hold on? I’m trying to plot all my graphs on the same axes. Some graphs are generated inside a for loop, and these are plotted separately from su and sl:
I need to recreate a chart similar to the one below created in Excel. I was hoping to use matplotlib, but can’t seem to find any examples or reference for how to do a chart like this. I need to have bars colored based on a performance threshold, and also display the threshold. Can anyone point me in the right direction? I do need to be able to do this with Python, though.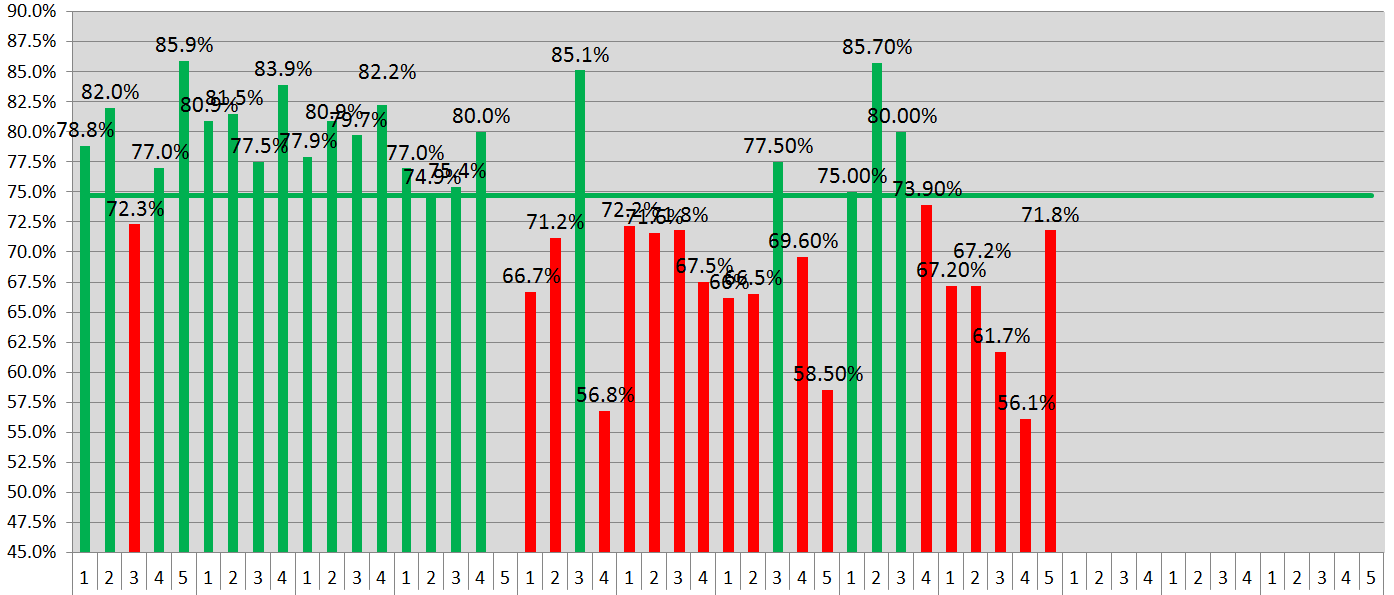
How can one neatly represent a graph in Python? (Starting from scratch i.e. no libraries!)
What data structure (e.g. dicts/tuples/dict(tuples)) will be fast but also memory efficient?
One must be able to do various graph operations on it.