python matplotlib framework under macosx?
I am getting this error:
I am getting this error:
Using the following code I can remove horizontal lines in images. See result below.
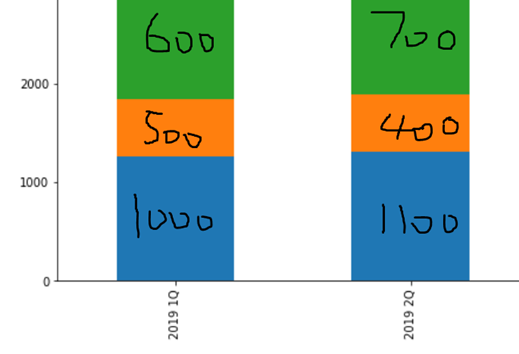
Below shows a plot of simulated data, which contains the xticks that I want to modify. By default, the pd.df.plot chooses dates that are approximately 3 months apart as ticks. But what I want is each month being a tick. What is the best way to do this? What about seasonal ticks? Thank you in advance.
I try to compile a Python project under Windows 7 using PyInstaller. The project works fine, there are no issues, however when I try to compile it the result doesn’t work. Though I get no warnings during compilation there are many in the warnmain.txt file in the build directory: warnmain.txt
Is there an explicit equivalent command in Python’s matplotlib for Matlab’s hold on? I’m trying to plot all my graphs on the same axes. Some graphs are generated inside a for loop, and these are plotted separately from su and sl:
How can I rotate xticklabels in matplotlib so that the spacing between each xticklabel is equal?
Can anyone help me set the ticks on a fixed position using matplotlib? I’ve tried using FixedPosition as this tutorial describes:
How can I plot the empirical CDF of an array of numbers in matplotlib in Python? I’m looking for the cdf analog of pylab’s “hist” function.
I have a function which returns a Figure created with pyplot. This function closes the figure before returning it. If I didn’t close it, showing it would be very easy with just plt.show(), but let us assume I cannot do that.