how to set boxplot heat color in python?
I have made some boxplots, similar to this:
I have made some boxplots, similar to this:
I have a set of X,Y data points (about 10k) that are easy to plot as a scatter plot but that I would like to represent as a heatmap.
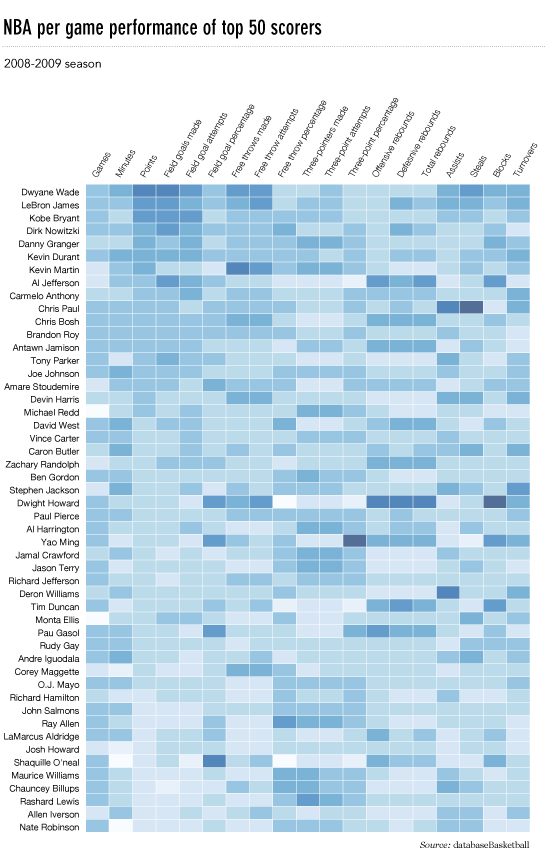
I’d like to make a heatmap like this (shown on FlowingData):
I have a dataframe generated from Python’s Pandas package. How can I generate heatmap using DataFrame from pandas package.
I am trying to create a heat map with python. For this I have to assign an RGB value to every value in the range of possible values. I thought of changing the color from blue (minimal value) over green to red (maximal value).