Matplotlib (pyplot) savefig outputs blank image
I am trying to save plots I make using matplotlib; however, the images are saving blank.
I am trying to save plots I make using matplotlib; however, the images are saving blank.
I cannot get the colorbar on imshow graphs like this one to be the same height as the graph, short of using Photoshop after the fact. How do I get the heights to match?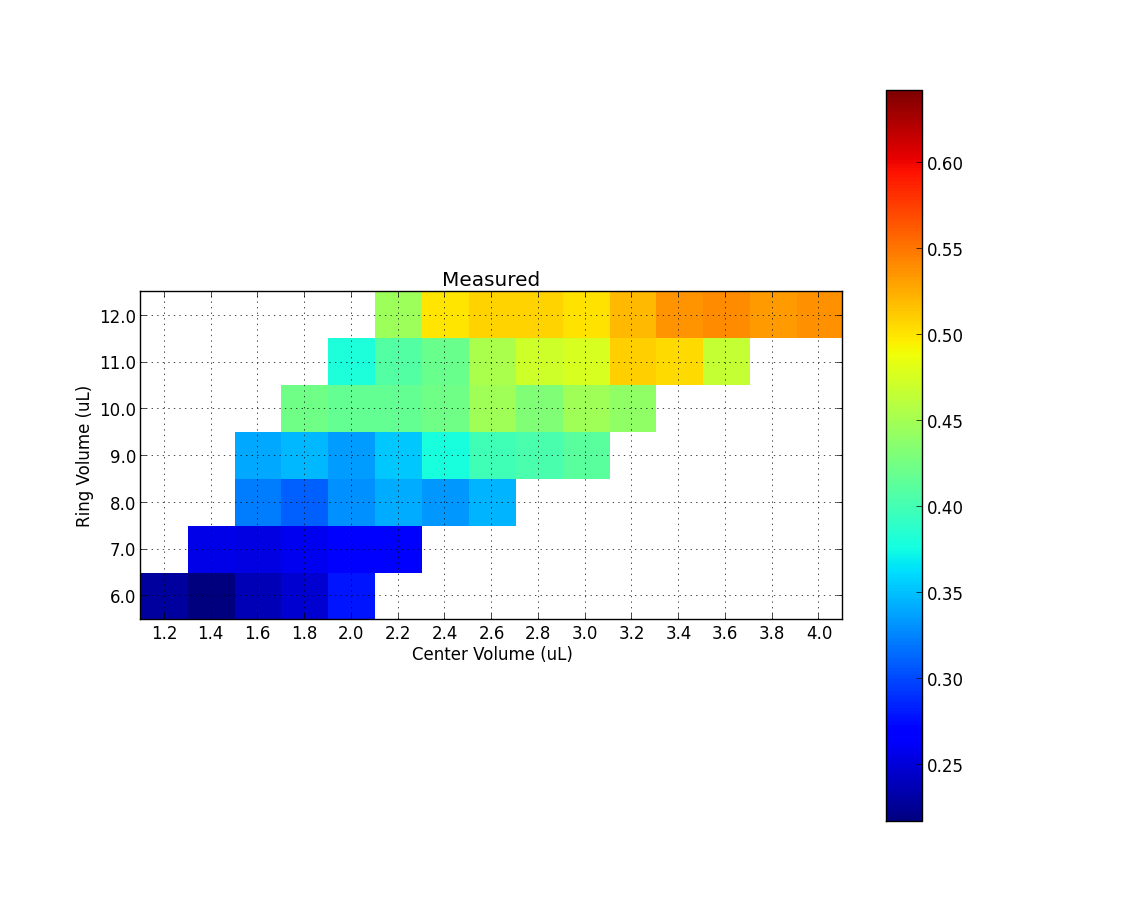
I have a plot with two y-axes, using twinx(). I also give labels to the lines, and want to show them with legend(), but I only succeed to get the labels of one axis in the legend:
I have create this simple env with conda:
Compare the following code:
I don’t understand what does comma after variable lines, means: http://matplotlib.org/examples/animation/simple_anim.html
I have the following problem, I want to create my own colormap (red-mix-violet-mix-blue) that maps to values between -2 and +2 and want to use it to color points in my plot.
The plot should then have the colorscale to the right.
How does one change the font size for all elements (ticks, labels, title) on a matplotlib plot?
I want to plot data of the following form, using matplotlib bar plot:
After these instructions in the Python interpreter one gets a window with a plot: