How to export plots from matplotlib with transparent background?
I am using matplotlib to make some graphs and unfortunately I cannot export them without the white background.
I am using matplotlib to make some graphs and unfortunately I cannot export them without the white background.
I am always bothered when I make a bar plot with pandas and I want to change the names of the labels in the legend. Consider for instance the output of this code:
I have dataframe total_year, which contains three columns (year, action, comedy) .
I am creating a plot in python. Is there a way to re-scale the axis by a factor? The yscale and xscale commands only allow me to turn log scale off.
I want to start the curve with one color and progressively blend into another color until the end. The following function in my MCVE works, but surely, there has to be a better way I haven’t found out about, yet?!
I am graphing out positions in a star cluster, my data is in a dataframe with x,y,z positions as well as a time index.
I plotted the eigenvectors of some 3D-data and was wondering if there is currently (already) a way to put arrowheads on the lines? Would be awesome if someone has a tip for me. 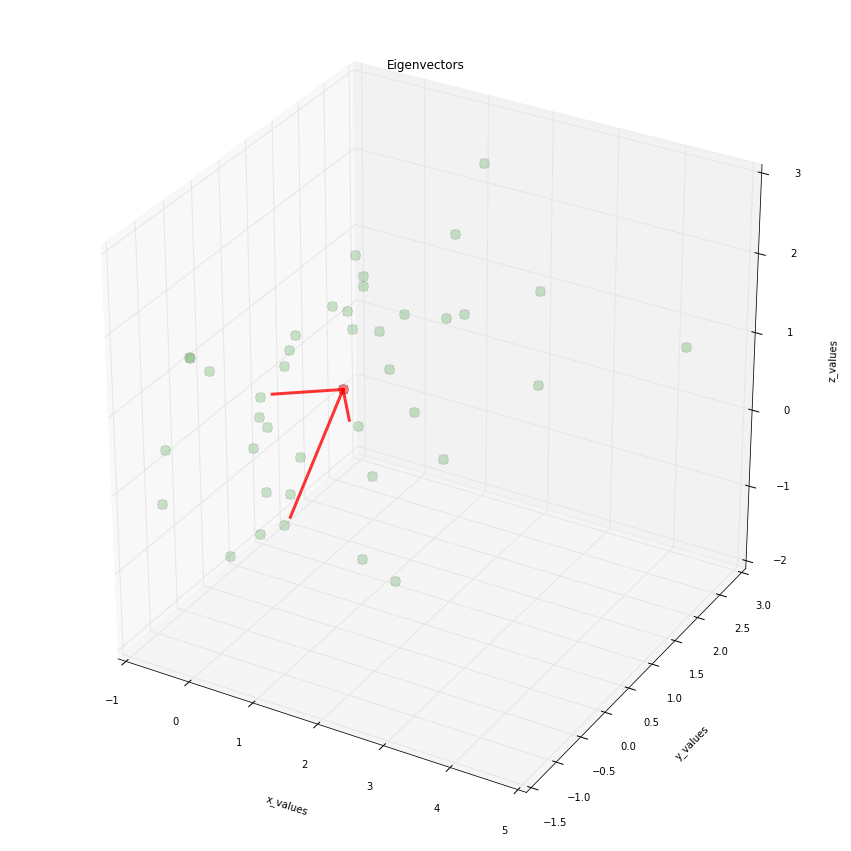
I have two Pandas DataFrames that I’m hoping to plot in single figure. I’m using IPython notebook.
So, it seems one cannot do the following (it raises an error, since axes does not have a set_linewidth method):
Suppose I run the following script: